
Worked lessons
How do I read a distance–time graph?
On a distance–time graph the slope tells you the speed. Height tells you the distance already travelled.
Worked example
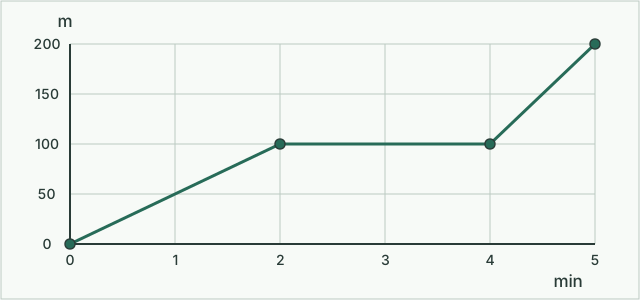
Plot minutes horizontally and metres vertically. Join (0,0), (2,100), (4,100) and (5,200) with straight lines. The first slope is 50 metres per minute. The next line is flat at 100 metres: time passes but no additional distance is travelled. The final slope is 100 metres per minute.
Try it yourself
Extend the line to (7,260). Is the walker faster or slower than in the final minute of the original graph?
Check your answer
The new segment covers 60 metres in two minutes, or 30 metres per minute. It ends higher because total distance increased, but its slope is smaller and the pace slower.
Try a lesson tonight. Learn together.
Two minutes to set up. The first five-minute lesson is free, no card needed. Pick a subject your child has homework in.
Try the free lessonLast checked . Tutorwell is an AI tutor, not a person, and it tells your child so.