
Exam practice
Digital SAT scatterplots and lines of best fit
Interpret a fitted slope as a change in predicted outcome for one extra unit of input. A residual is observed minus predicted.
Worked practice
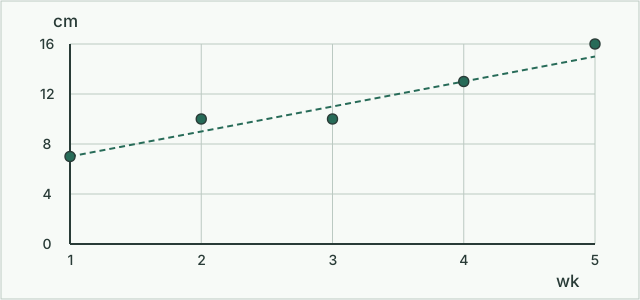
Suppose a line for seedlings is height = 2 × week + 5 cm, based on weeks 1 through 5. Observations for those weeks are 7, 10, 10, 13 and 16 cm. At week two the line predicts 9 cm. The observed seedling is 1 cm above it.
Try it yourself
Find the residual at week three and the predicted height at week 4.5. Which prediction would need more evidence: week 4.5 or week 20?
Check your answer
At week three it is 10 − 11 = −1 cm. Week 4.5 gives 14 cm inside the observed range. Week 20 extrapolates far beyond these seedlings' measurements.
Exam reference
See College Board's SAT section guide for the skills assessed. These questions are original practice.
Try a lesson tonight. Learn together.
Two minutes to set up. The first five-minute lesson is free, no card needed. Pick a subject your child has homework in.
Try the free lessonLast checked . Tutorwell is an AI tutor, not a person, and it tells your child so.