
Worked lessons
How do I explain a plateau on a photosynthesis graph?
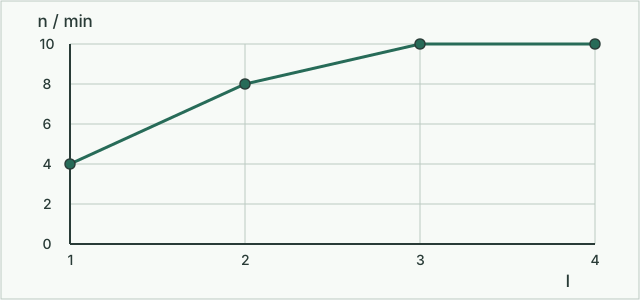
A plateau shows that increasing the plotted factor no longer increases the measured rate under those conditions.
Worked example
At light settings 1, 2, 3 and 4, an aquatic plant releases 4, 8, 10 and 10 bubbles per minute. Plot the pairs and compare the steep early rise with the final flat segment. Bubble count is a proxy and bubble sizes may differ. Carbon dioxide availability is one possible limit.
Try it yourself
How could you test the carbon dioxide idea without changing two conditions at once?
Check your answer
Hold light at setting 4 and keep plant size and temperature constant. Vary carbon dioxide supply and measure oxygen volume over equal times. A rise would support the hypothesis under those conditions.
Try a lesson tonight. Learn together.
Two minutes to set up. The first five-minute lesson is free, no card needed. Pick a subject your child has homework in.
Try the free lessonLast checked . Tutorwell is an AI tutor, not a person, and it tells your child so.